Clarify the decision
Start with the business question, not the chart.
DATA REPORTING ANALYST · POWER BI DEVELOPER · DATA SCIENTIST
I combine a software development and database background with business intelligence, reporting automation, and applied data science to transform complex operational data into reliable solutions and decisions people can act on.
ABOUT
I am a Data Reporting Analyst with a Bachelor’s degree in Computer Science, a Master of Science in Data Analytics, and previous professional experience in software development, programming, and database-driven applications.
My background includes application development, PostgreSQL, SQL reporting, business intelligence, automation, and advanced analytics. Earlier in my career, I built database-backed intranet reports and investigated operational data to answer questions for Accounting, Human Resources, payroll, operations, and client reporting. That experience helps me understand how systems are structured, how data moves between sources, and how to build reliable reporting and analytical solutions.
I am especially effective when reporting is manual, data is fragmented, metric definitions are unclear, or stakeholders need a stronger way to understand performance. I gather requirements, validate source data, develop reliable solutions, and communicate findings in language technical and business teams can use.
Start with the business question, not the chart.
Define logic, validate sources, and make calculations transparent.
Create reporting that helps teams prioritize and respond.
CORE EXPERTISE
I combine analytics, reporting development, automation, data integration, and a software-development background across the full data lifecycle.
Interactive dashboards, semantic models, DAX measures, KPI frameworks, drill-through experiences, executive reporting, and ongoing Power BI model enhancement.
Operational, workforce, service, and business analysis supported by SQL query review, data validation, reporting logic, and strong systems knowledge.
Enhance and maintain reporting data across ServiceNow, SQL, Excel, and Power BI. Add required source tables, validate relationships, review query logic, investigate dataset failures, and resolve refresh or data-quality issues.
Classification, feature engineering, model comparison, evaluation, text mining, and translation of findings into business implications.
Workflow redesign, reporting automation, recurring process optimization, requirements analysis, and quality control.
FEATURED WORK
Confidential workplace projects are presented as sanitized case studies. Public demonstrations should use recreated or sample data.
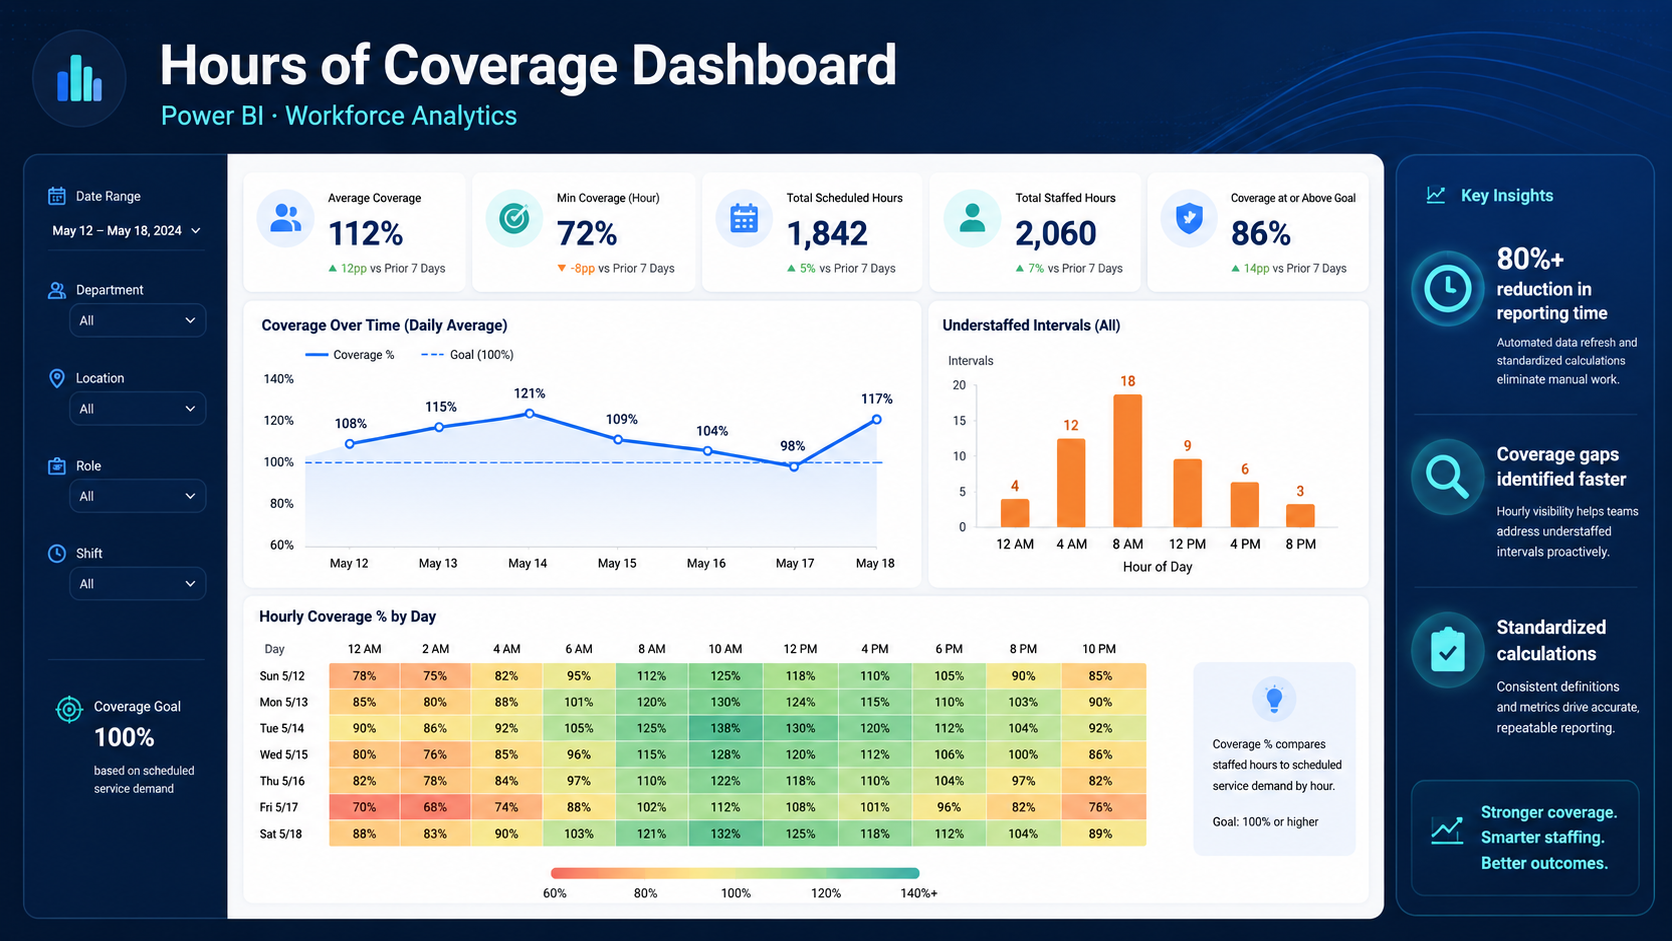 Recreated with sample data
POWER BI · WORKFORCE ANALYTICS
Replaced a heavily manual staffing analysis with an interactive Power BI solution that surfaced coverage gaps, peak demand periods, and recurring scheduling patterns.
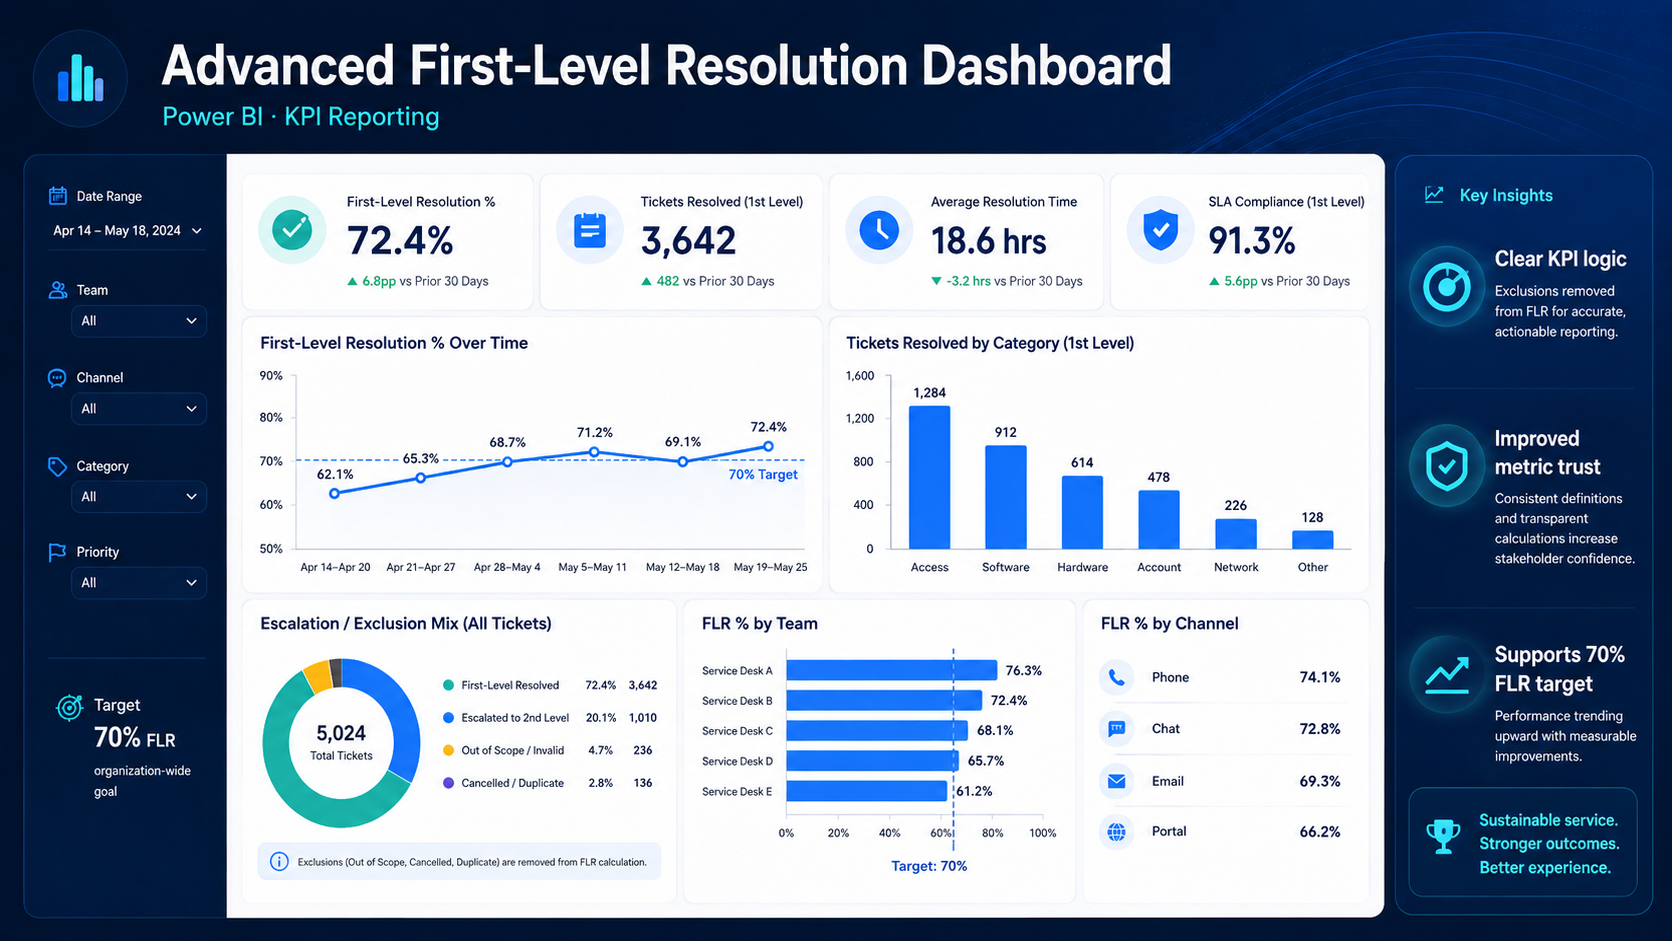 Portfolio visualization
POWER BI · SERVICE ANALYTICS
Designed performance reporting with transparent KPI logic, exclusion handling, trend views, and operational drill-downs.
View case study →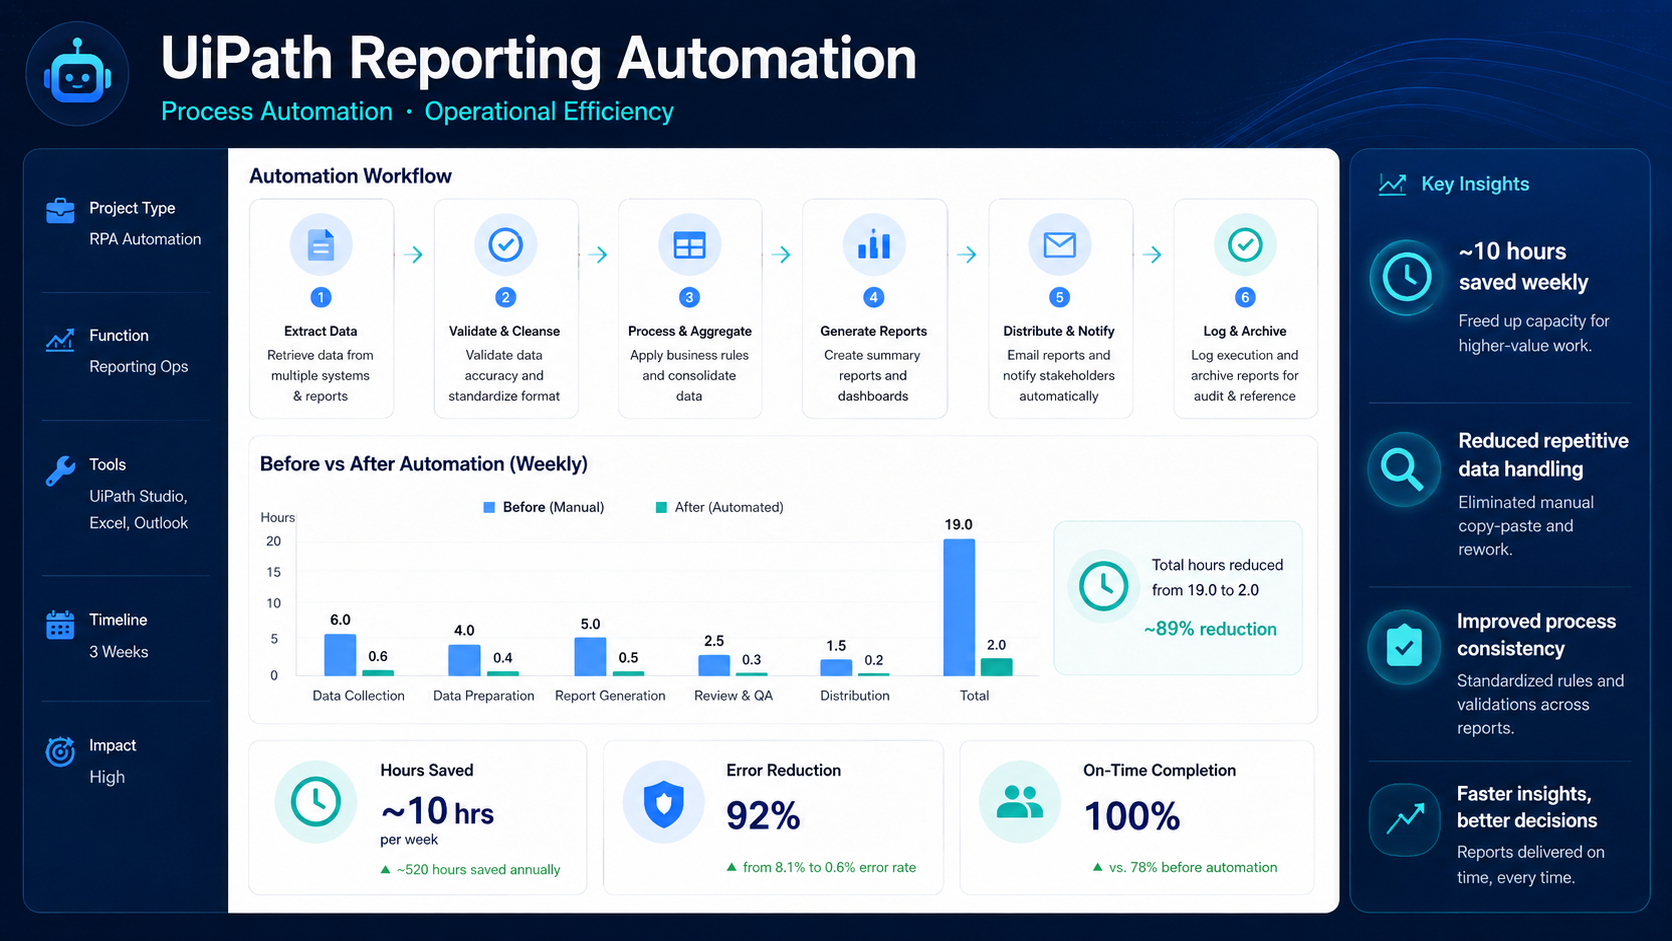 Portfolio visualization
UIPATH · PROCESS AUTOMATION
Automated repetitive data preparation and reporting steps to improve consistency, speed, and on-time delivery.
View case study →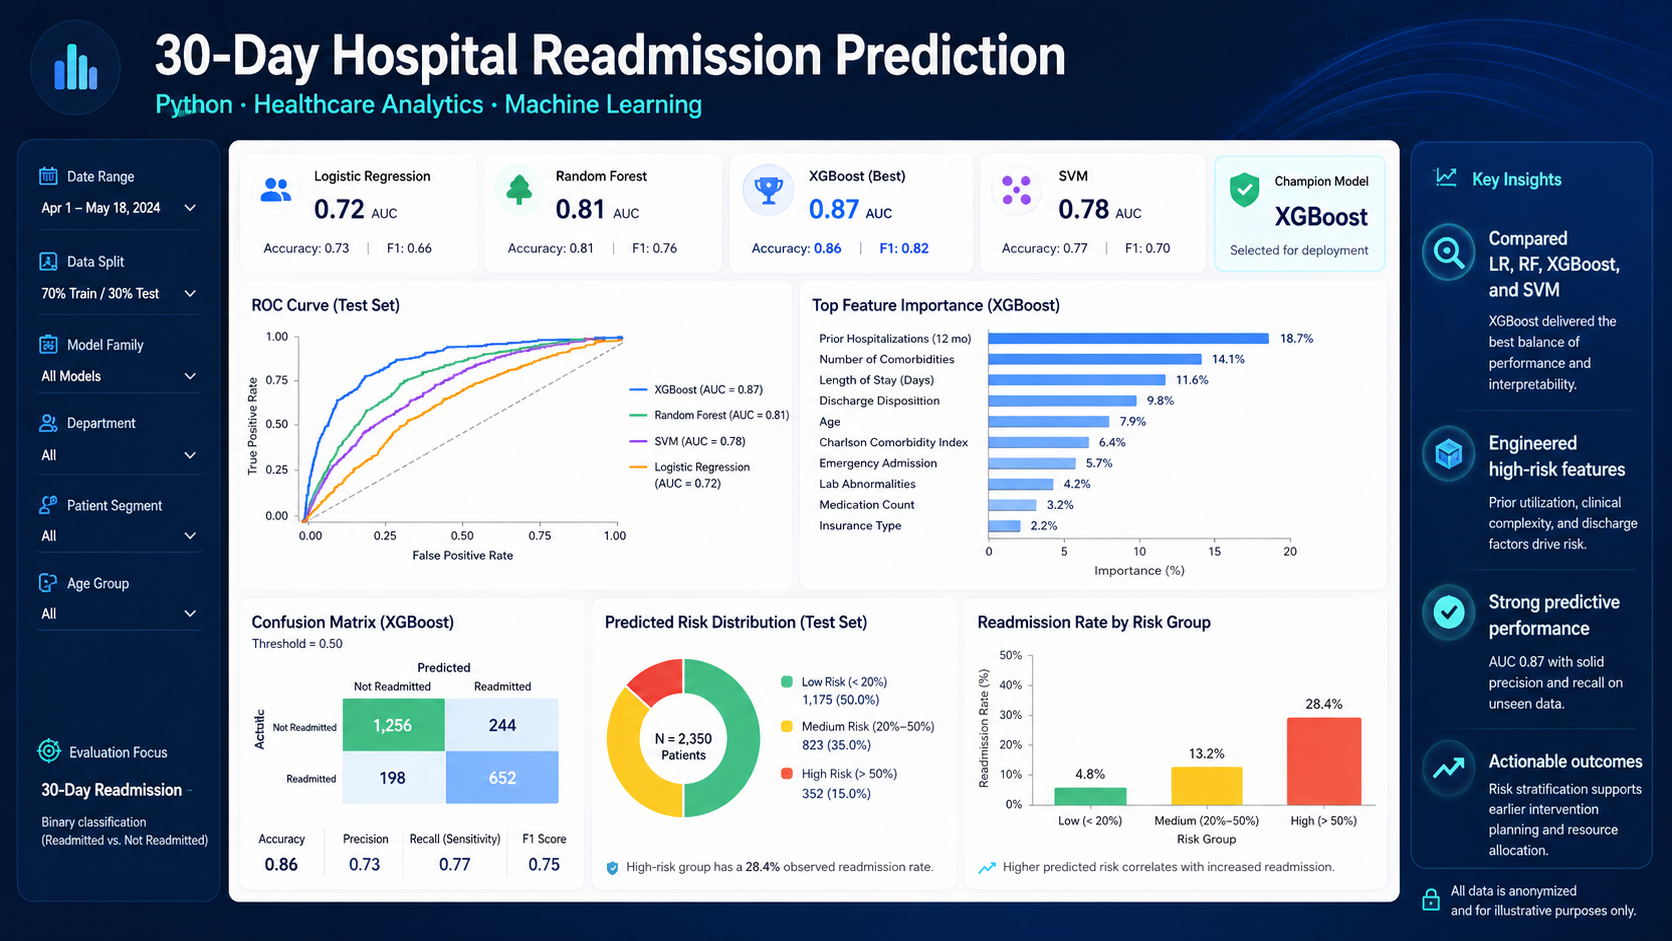 Graduate analytics project
PYTHON · HEALTHCARE ANALYTICS
Built and compared classification models to identify factors associated with hospital readmission risk.
View case study →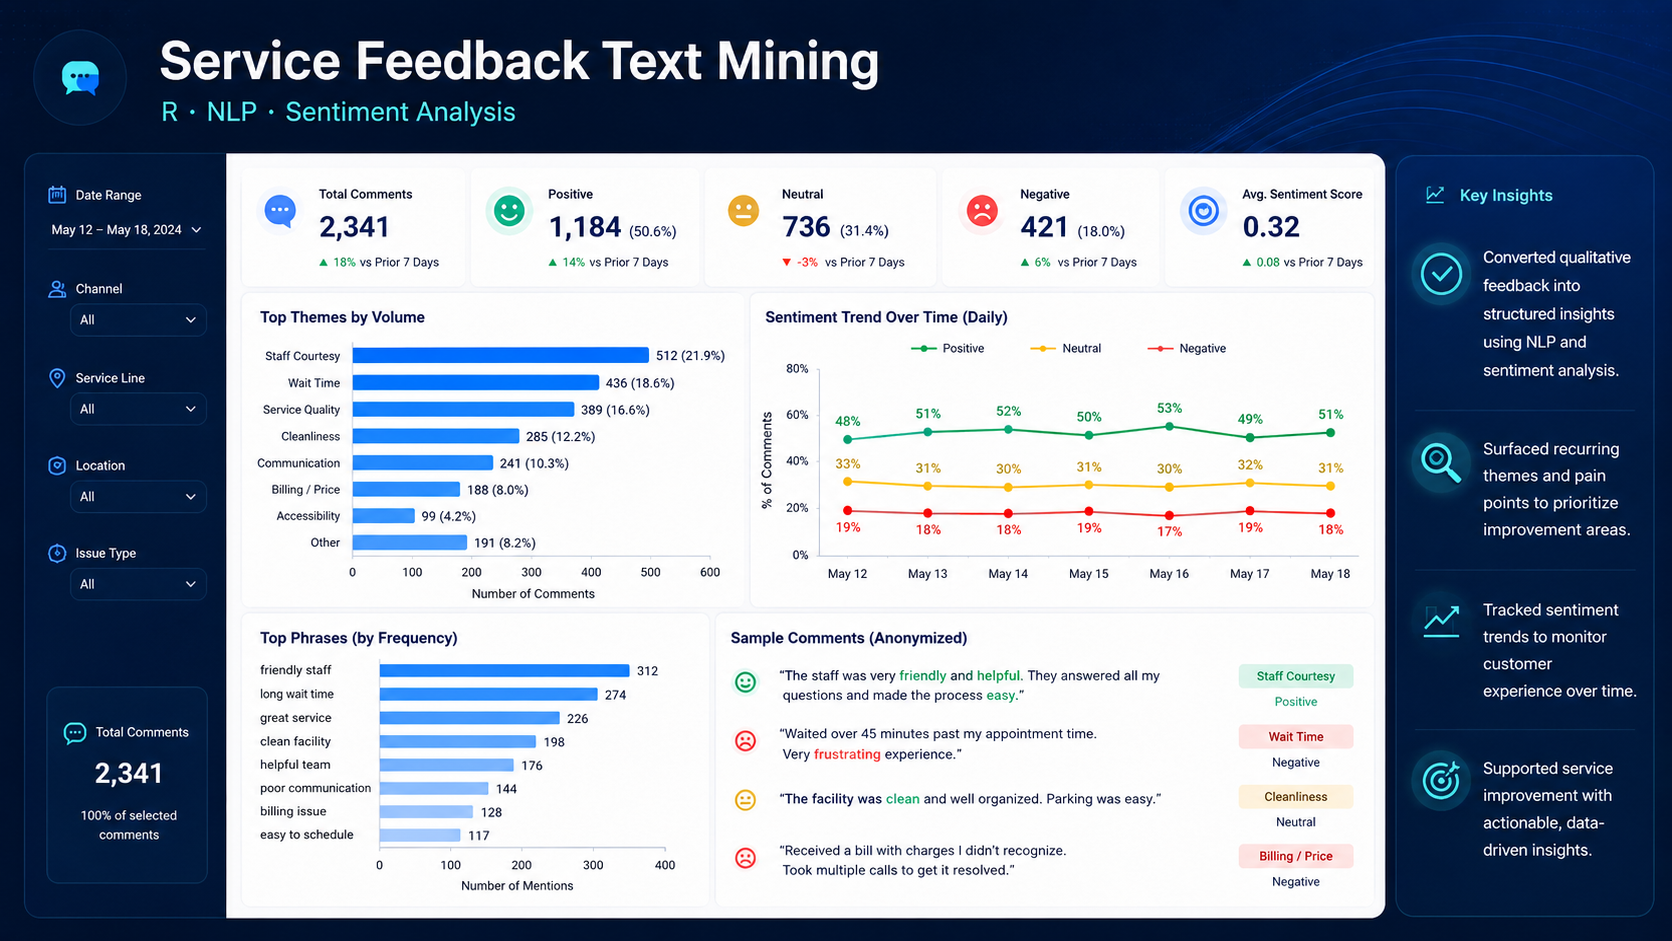 Graduate analytics project
R · NLP · TEXT MINING
Converted unstructured feedback into sentiment trends and recurring themes that could guide service improvements.
View case study →MASTER'S DEGREE PROJECTS
These projects demonstrate breadth across statistical learning, machine learning, reinforcement learning, AutoML, and applied artificial intelligence.
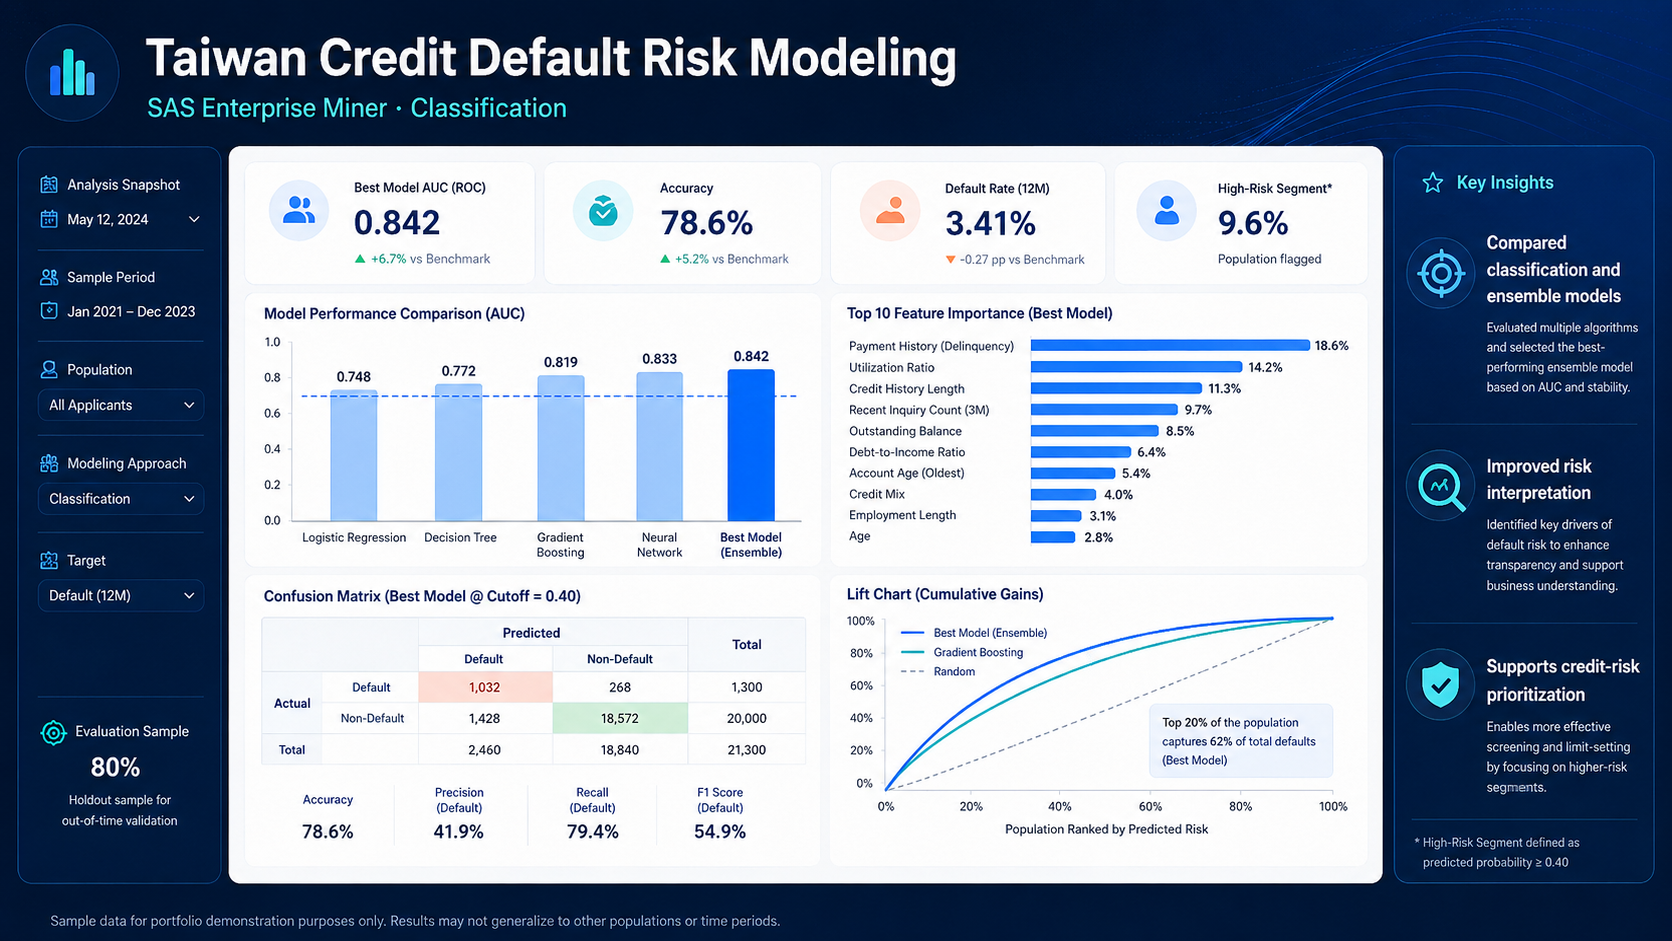
SAS ENTERPRISE MINER · CLASSIFICATION
Compared classification and ensemble approaches for predicting customer credit-card default, with emphasis on model performance and risk interpretation.
View project →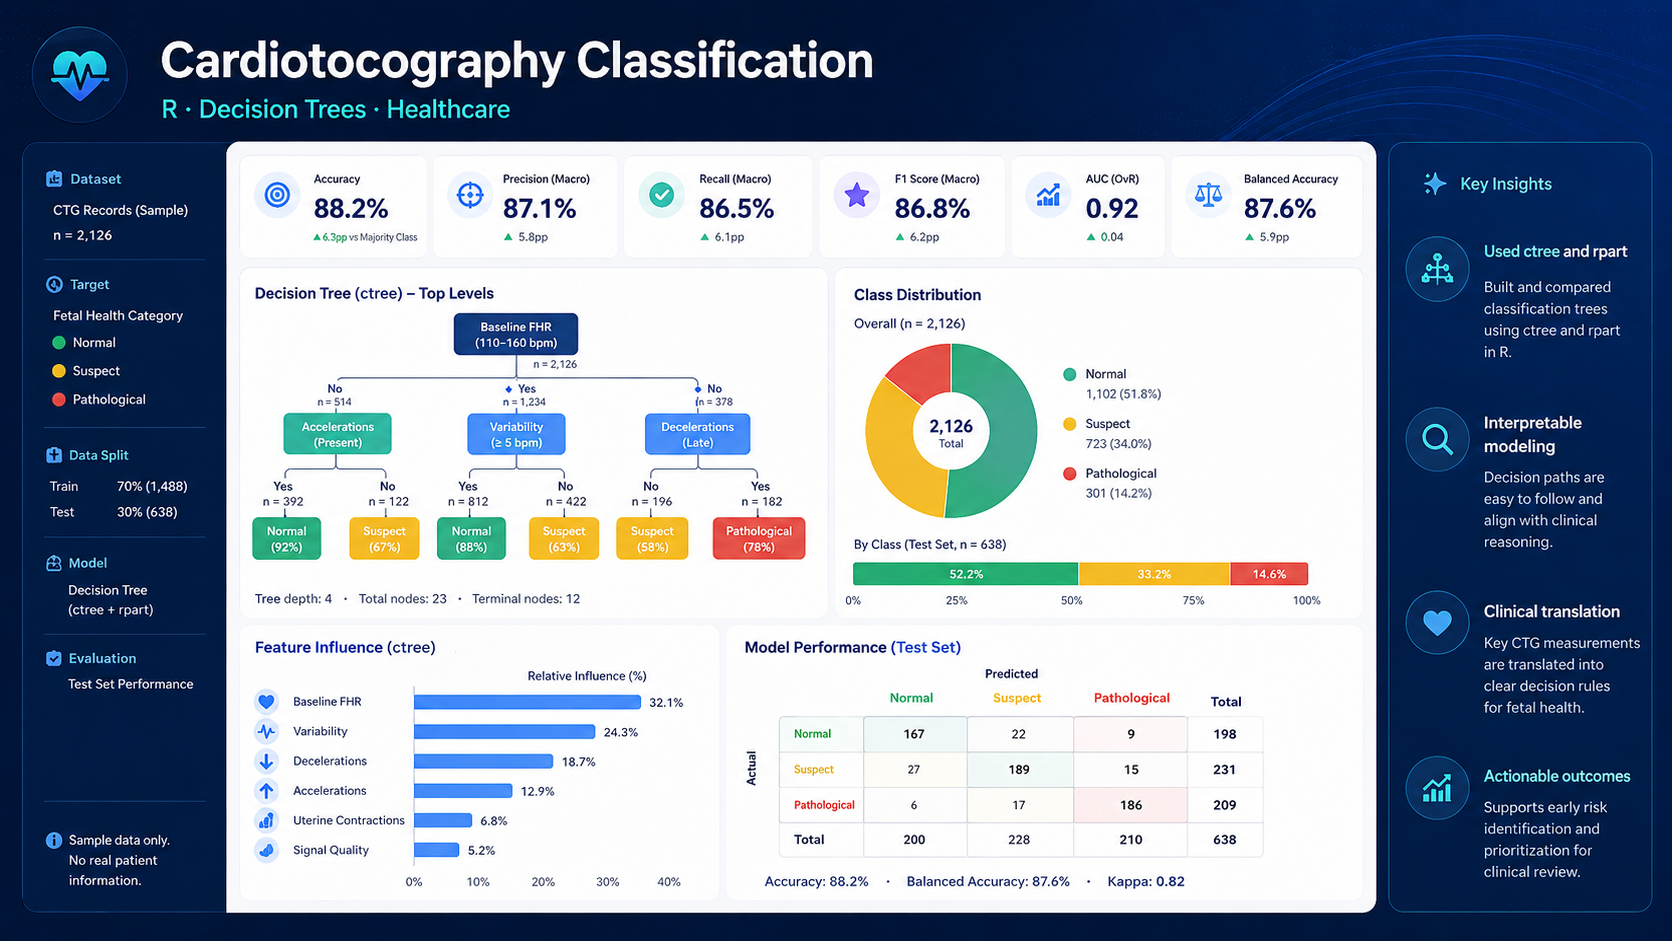
R · DECISION TREES · HEALTHCARE
Applied conditional inference trees and recursive partitioning to classify fetal health patterns from cardiotocography measurements.
View project →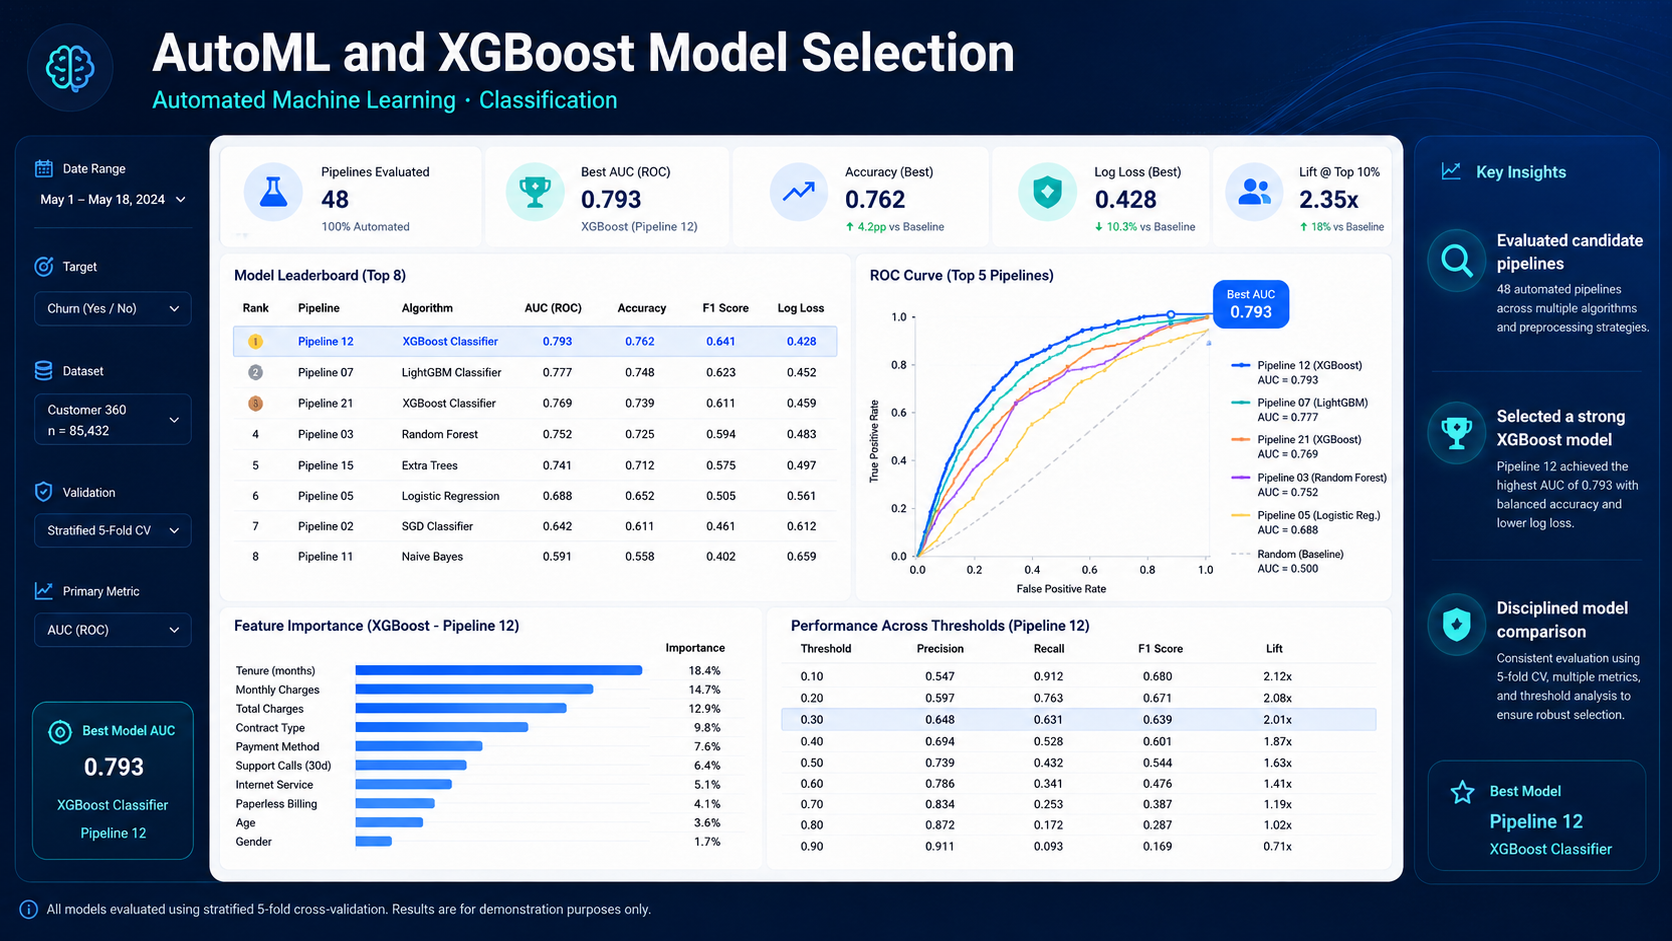
AUTOML · XGBOOST · MODEL EVALUATION
Used an AutoML workflow to test candidate pipelines, compare models, and select a high-performing XGBoost solution with an AUC near 0.79.
View project →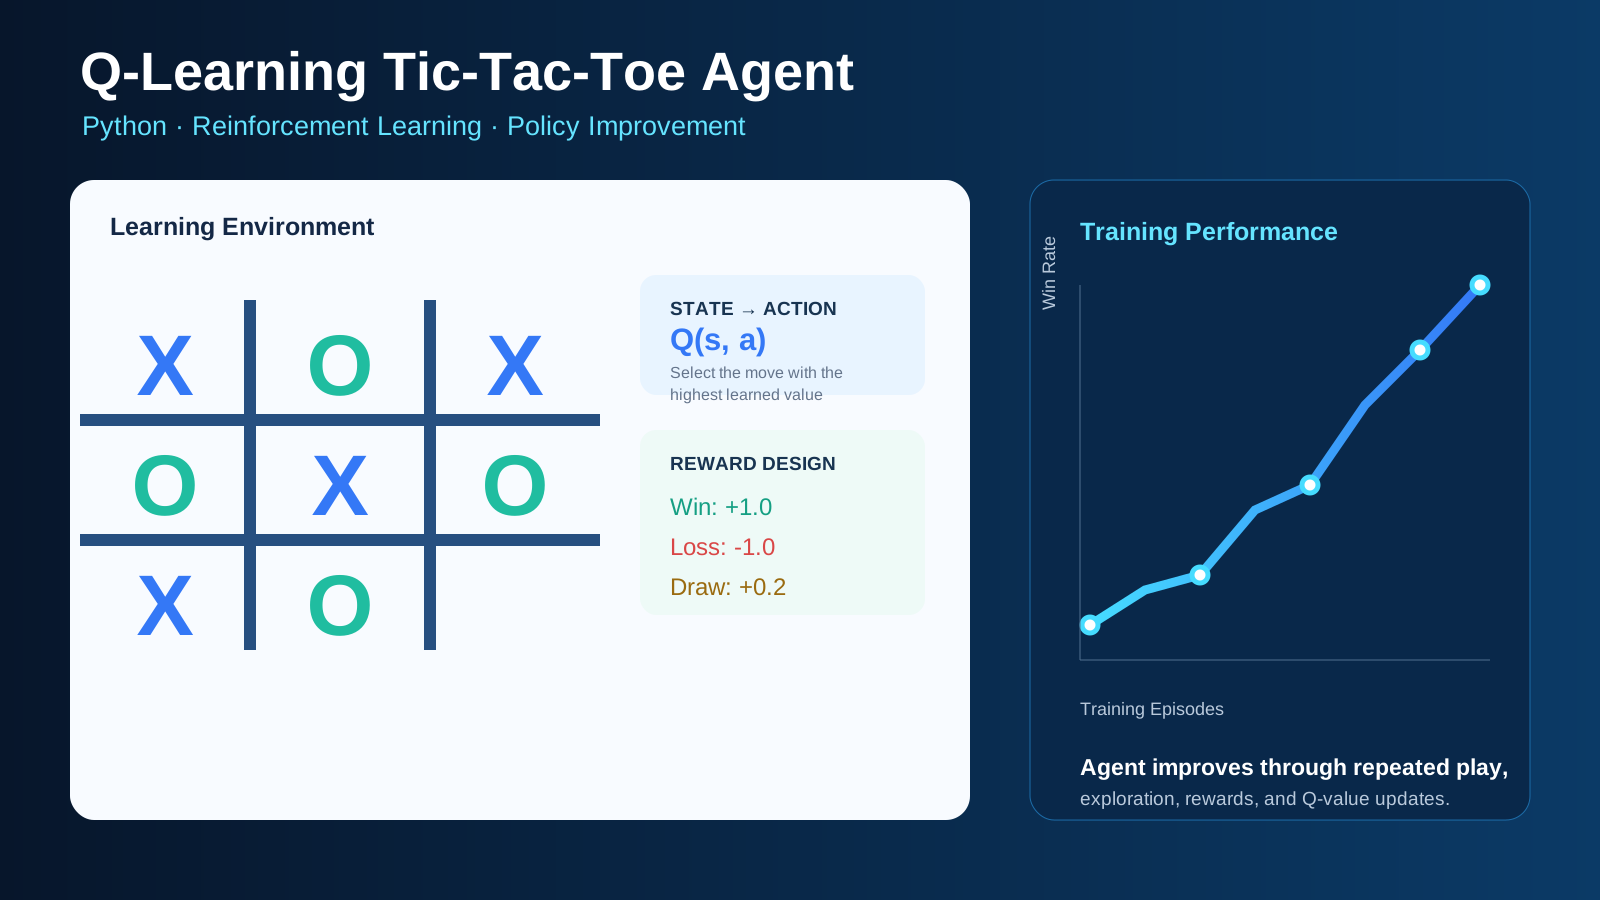
PYTHON · REINFORCEMENT LEARNING
Developed a reinforcement-learning agent that improved its play through repeated interaction, rewards, and Q-value updates.
View project →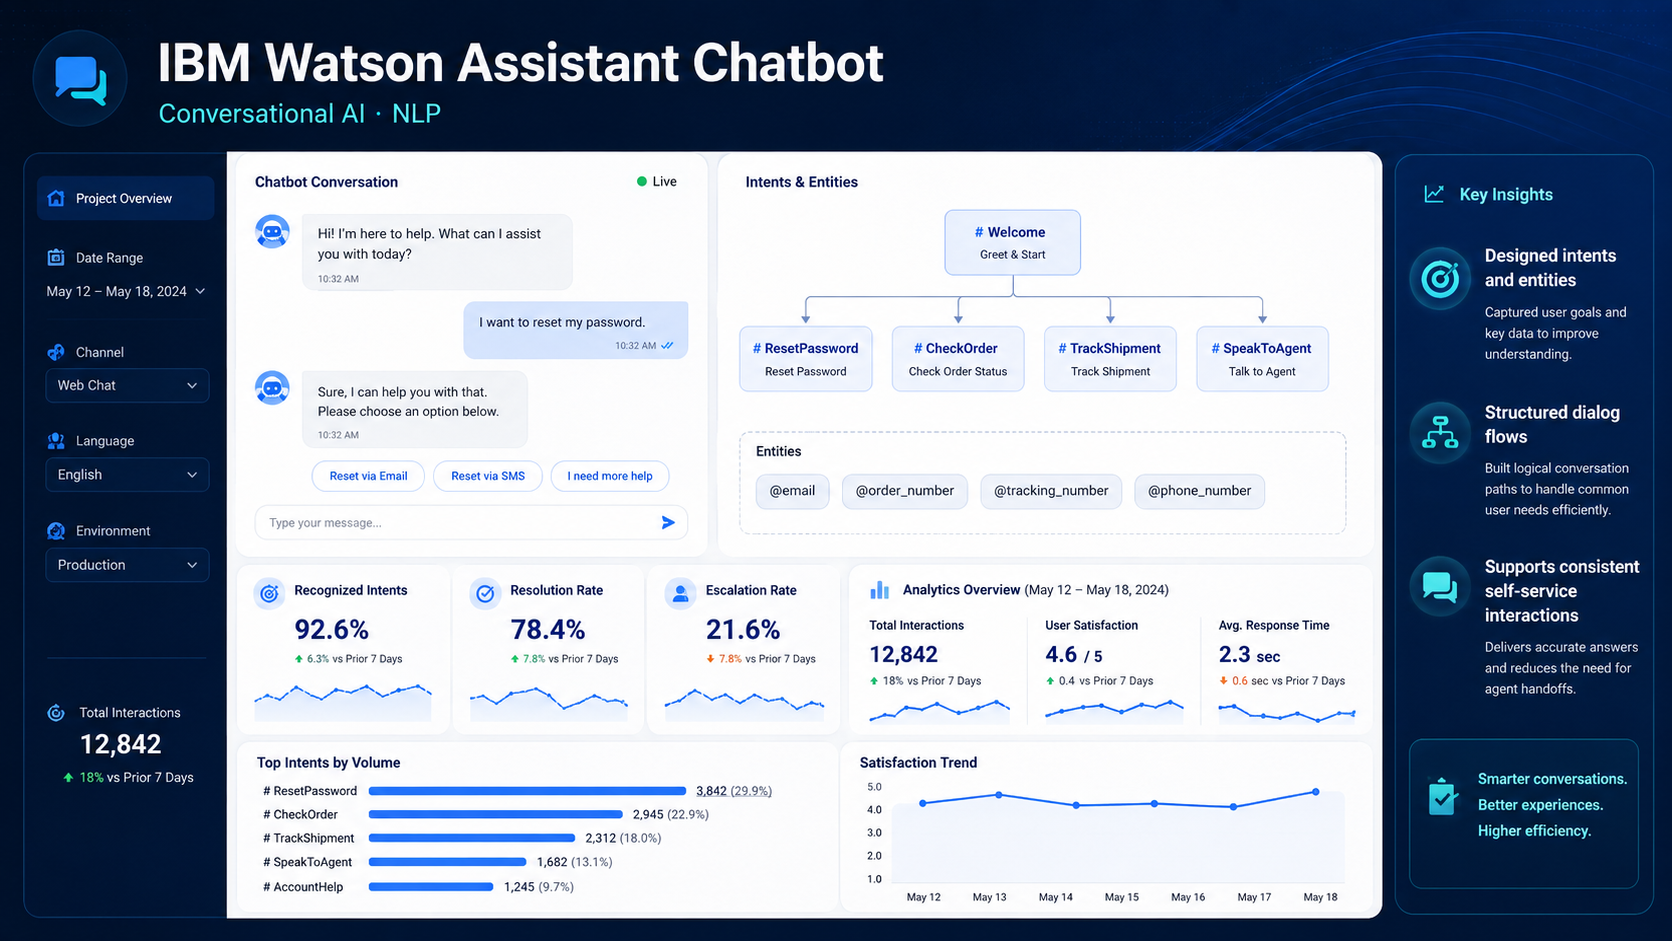
IBM WATSON · CONVERSATIONAL AI
Developed an IBM Watson Assistant chatbot to help parents find summer camp options in the Baltimore, Maryland area using intents, entities, and structured dialog flows.
View project →
MASTER'S CAPSTONE · END-TO-END ANALYTICS
The capstone remains the flagship academic case study because it combines data preparation, feature engineering, model comparison, and business interpretation.
View capstone →ADDITIONAL CASE STUDIES
Projects demonstrating ownership across digital operations, reporting integration, software development, and database-backed solutions.
 Volunteer project
VOLUNTEER · DIGITAL TRANSFORMATION
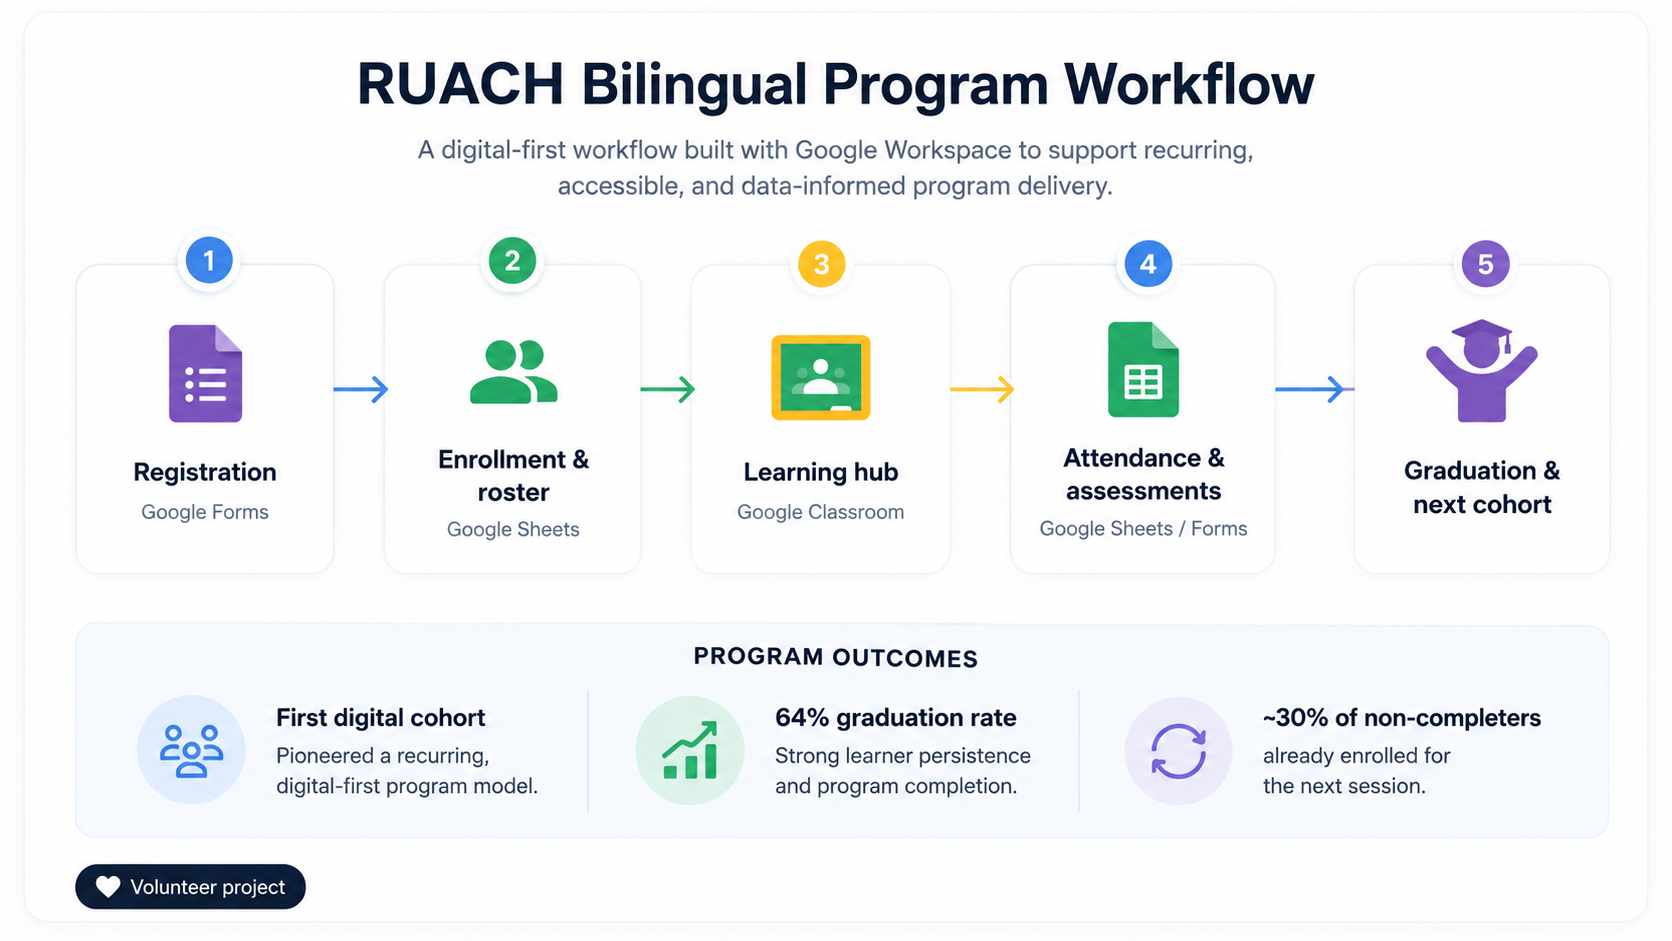
Turned a “maybe one day” ministry vision into a reliable bilingual digital program that now supports recurring sessions throughout the year. The first fully digital cohort achieved a 64% graduation rate, and approximately 30% of non-completers have already enrolled for the next session.
View case study →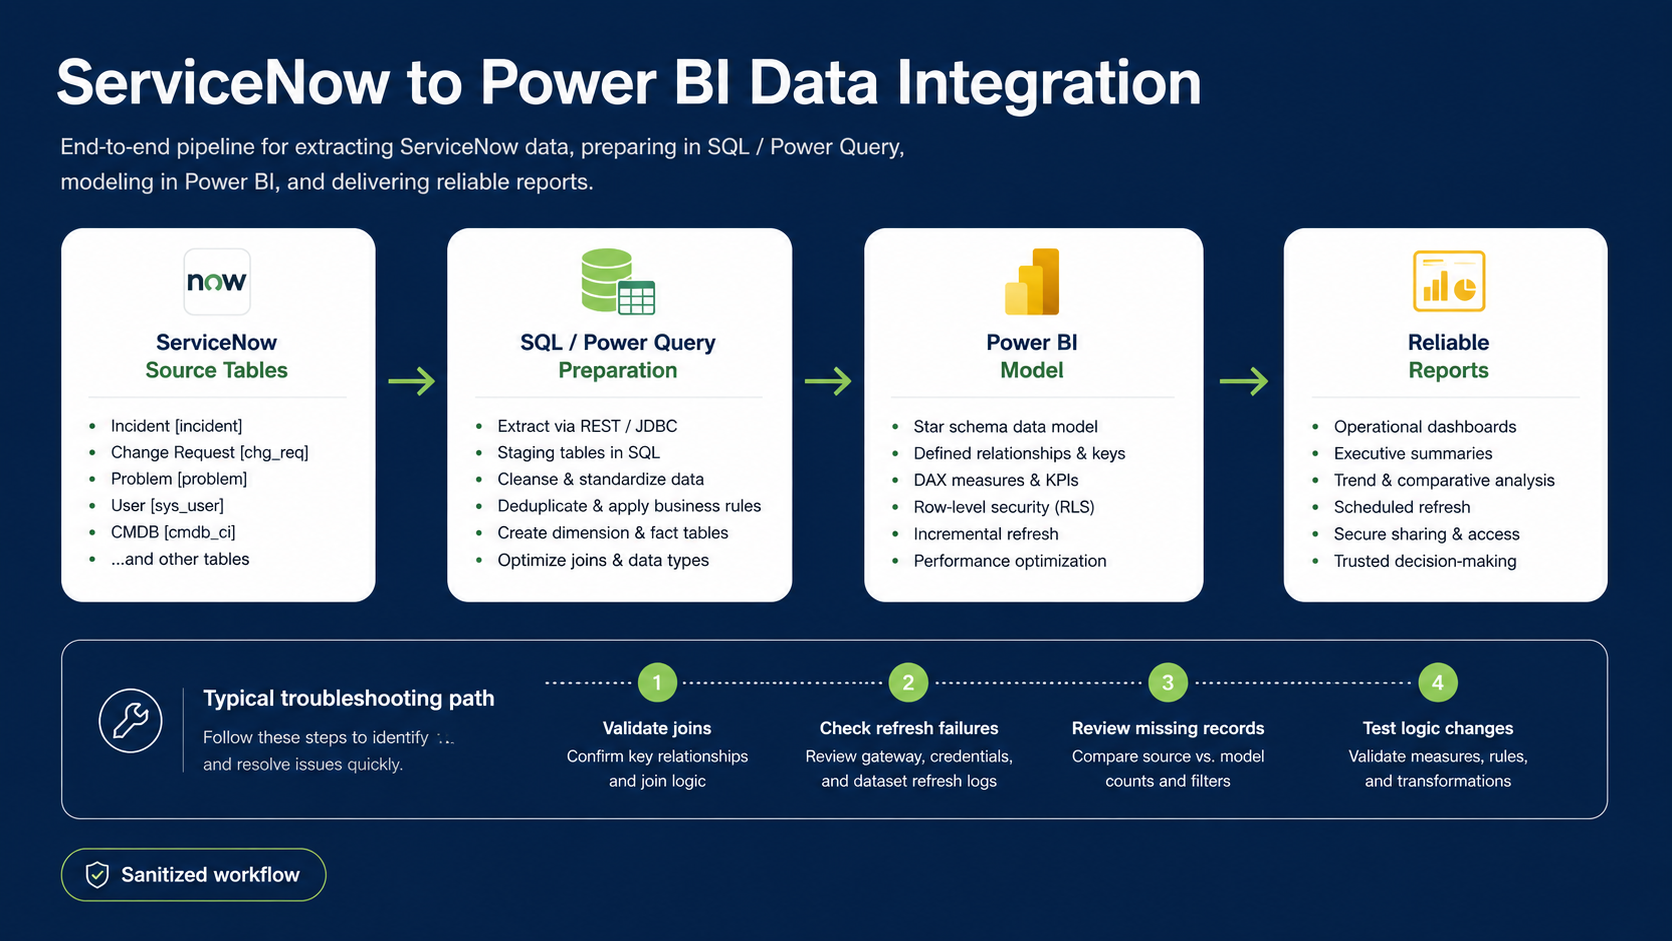 Sanitized workflow
SERVICENOW · SQL · POWER BI
Enhance Power BI datasets by adding required ServiceNow tables, reviewing SQL and Power Query logic, validating model relationships, and resolving refresh, missing-data, or data-quality issues.
View case study →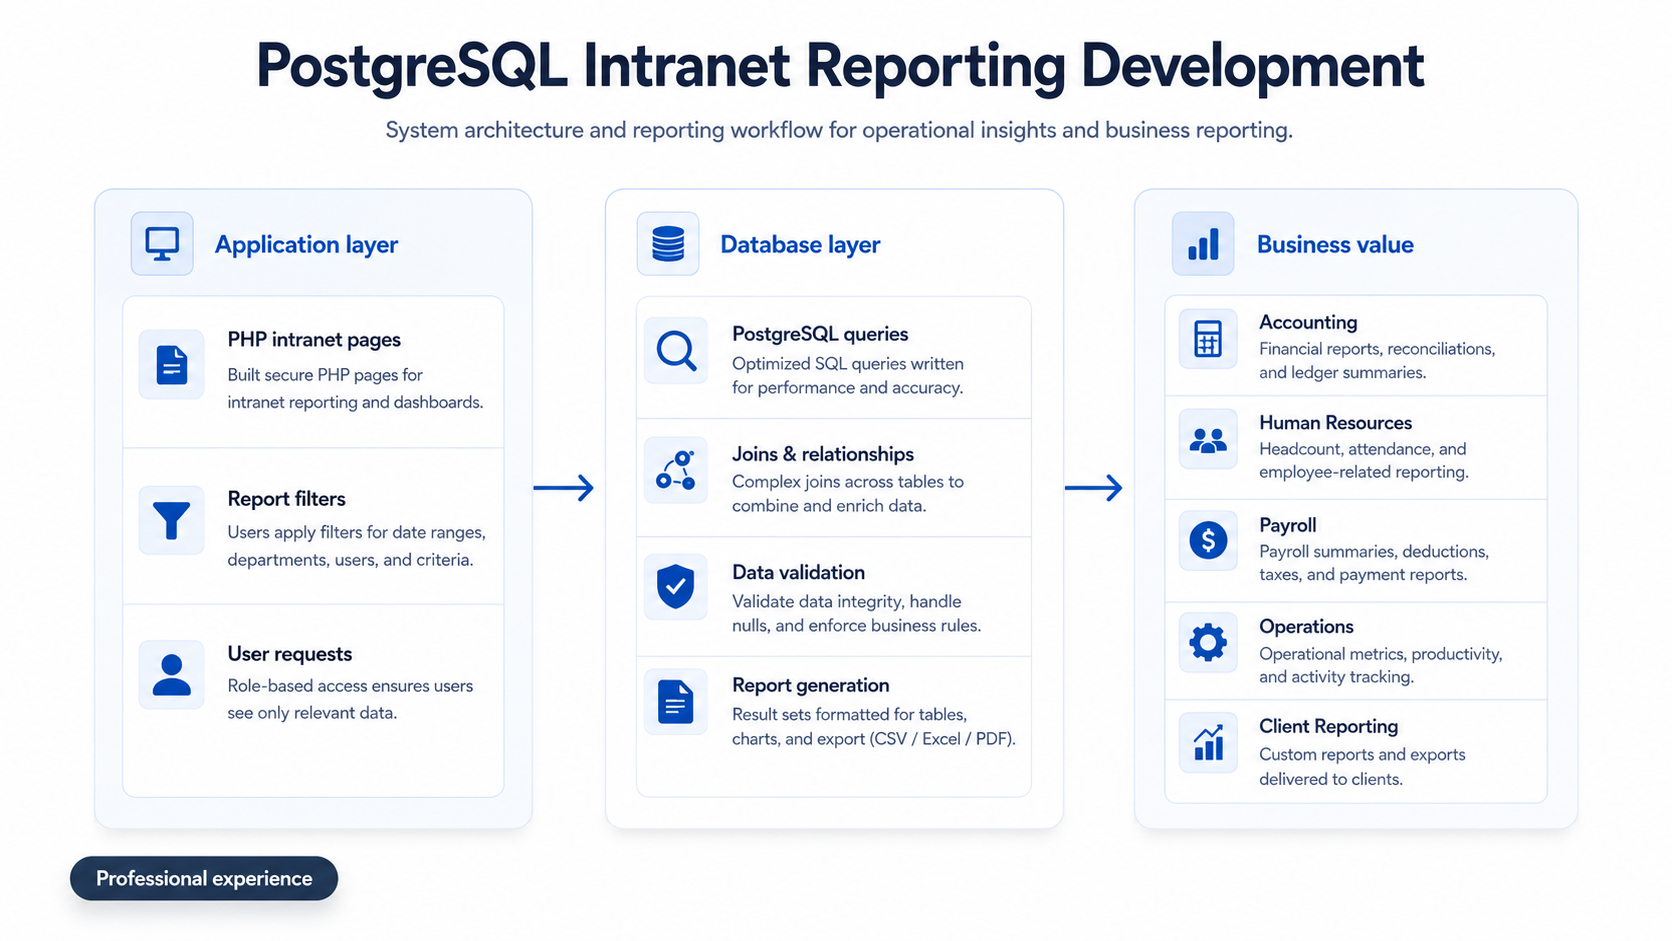 Professional experience
DATA ANALYSIS · SOFTWARE DEVELOPMENT · POSTGRESQL
Built PHP and PostgreSQL intranet reports, investigated operational data, and answered reporting questions for Accounting, Human Resources, payroll, operations, and client-facing needs.
View case study →EXPERIENCE & EDUCATION
Computer Aid, Inc. · Remote
Develop Power BI dashboards, automate reporting, validate operational metrics, analyze service performance, and translate stakeholder requirements into scalable reporting solutions.
University of Maryland Global Campus · Part-time
Support students in artificial intelligence, data analytics, cloud computing, and technical lab environments. Investigate reported issues, reproduce technical problems, document resolutions, and collaborate with students, instructors, and technical teams.
Computer Aid, Inc. · Remote
Delivered high-volume technical support and developed the operational understanding that now informs service analytics, KPI reporting, and process improvement work.
UNO Software Development
Built PHP and PostgreSQL intranet applications and reporting pages, analyzed operational data, investigated department questions, and prepared reports supporting Accounting, Human Resources, payroll, operations, and client deliverables.
Freelance · Entrepreneurial projects
Designed and delivered websites and database-backed solutions for clients beginning during college. Managed requirements, development, troubleshooting, and delivery, including administrative and reporting functionality based on client needs.
LET’S WORK TOGETHER
I am pursuing remote Data Reporting Analyst, Power BI Developer, Business Intelligence, Workforce Analytics, and applied Data Science opportunities.