THE PROBLEM
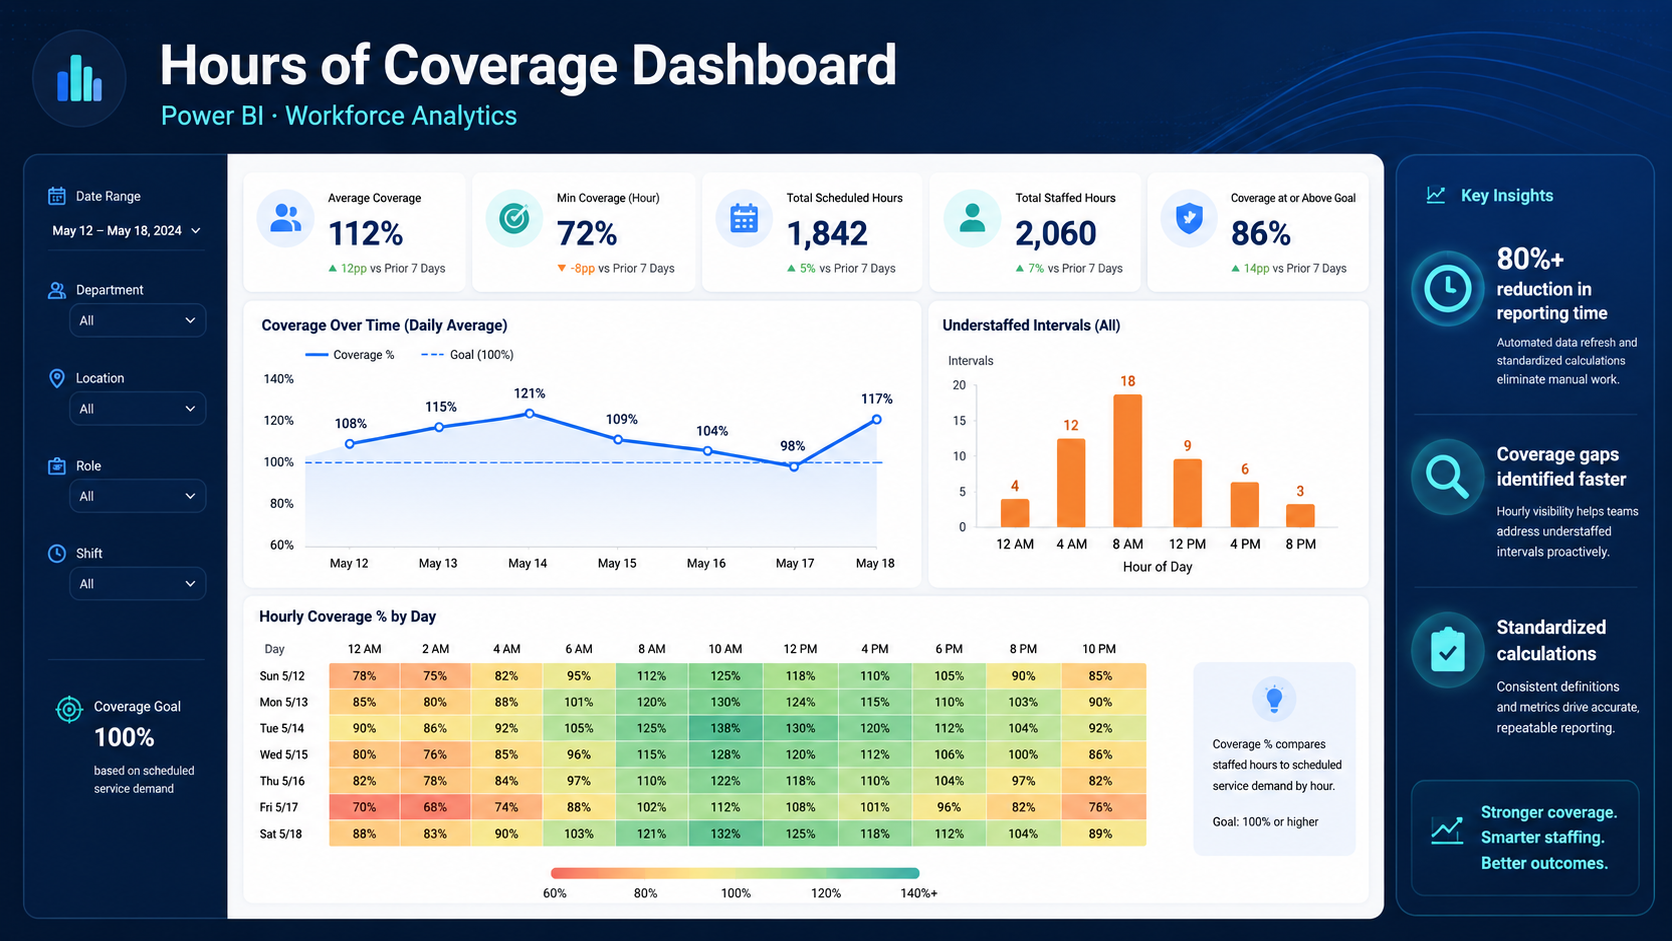
A recurring staffing coverage report was heavily manual, time-consuming, and difficult to review consistently.
THE APPROACH
Designed a Power BI reporting solution that combined schedule and interval-level information into a repeatable analytical view. The dashboard emphasized coverage percentages, gap hours, peak intervals, and recurring staffing patterns.
THE OUTCOME
Reduced recurring reporting effort by more than 80%, standardized key calculations, and gave leaders a faster way to identify coverage risks.
TOOLS
Power BIDAXPower QueryExcelWorkforce Analytics
Confidentiality note: This case study highlights the business problem, analytical approach, and impact while protecting confidential company and client information. Any public visuals or demonstrations use recreated or sample data.