THE PROBLEM
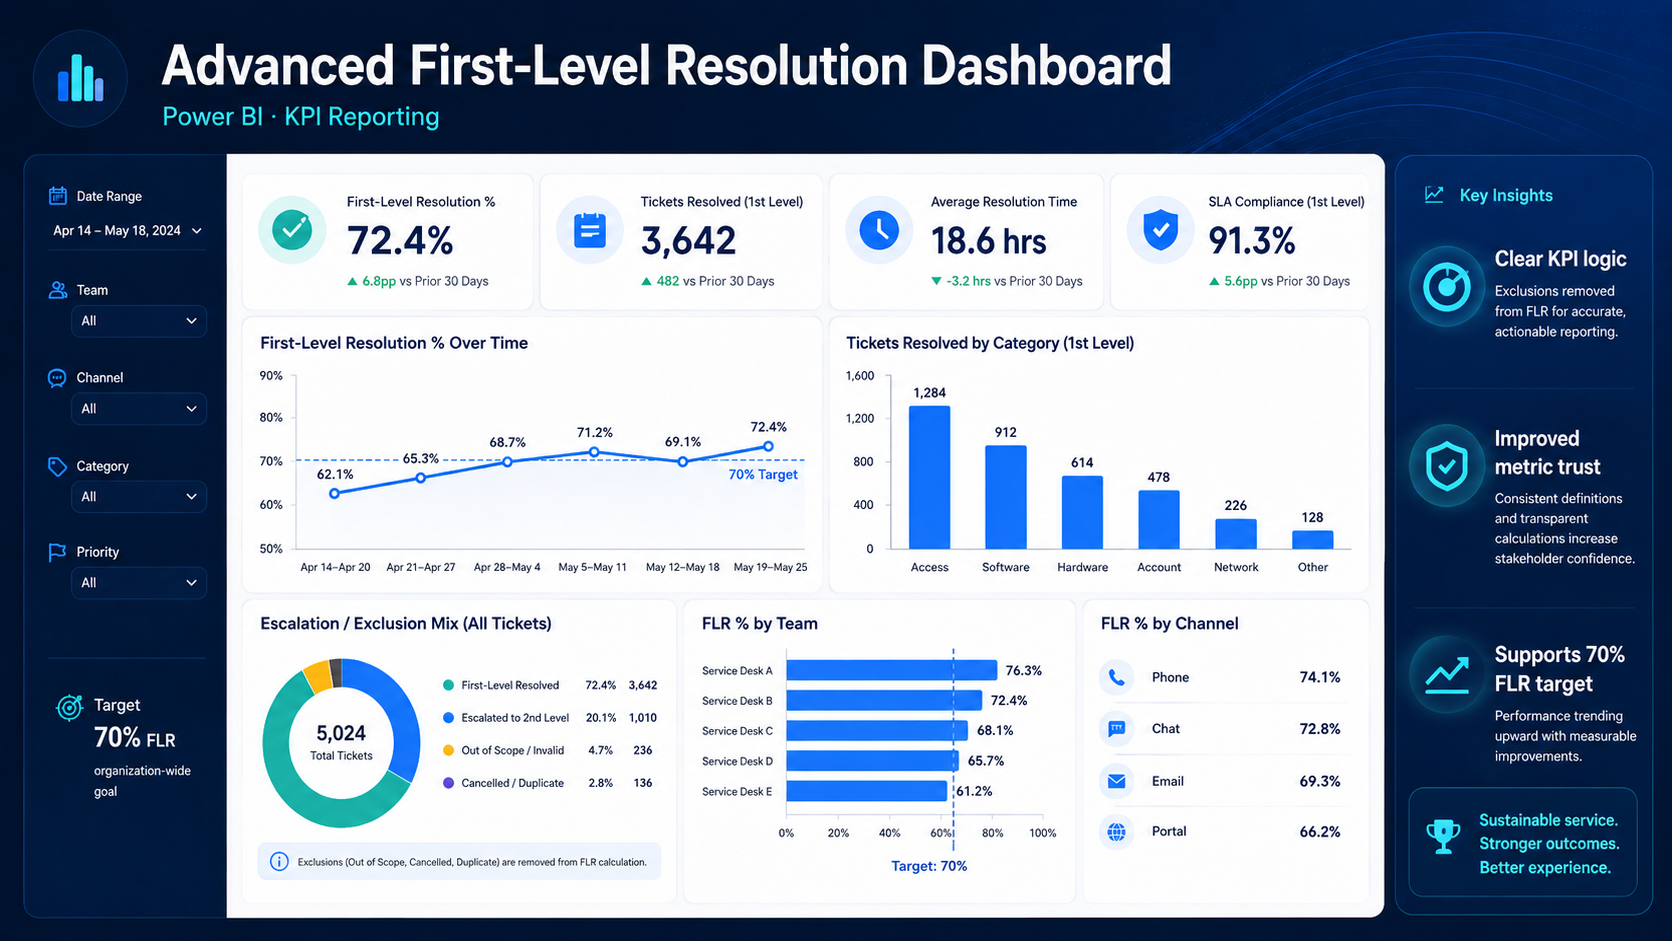
Operational leaders needed a clearer and more trustworthy view of first-level resolution performance, including the effect of exclusions and changes over time.
THE APPROACH
Defined KPI logic, validated source data, created DAX measures, and developed performance views for trends, targets, exclusions, and operational drill-downs.
THE OUTCOME
Improved transparency around the metric and supported monitoring against a 70% first-level resolution target.
TOOLS
Power BIDAXServiceNowKPI DesignData Validation
Confidentiality note: This case study highlights the business problem, analytical approach, and impact while protecting confidential company and client information. Any public visuals or demonstrations use recreated or sample data.